A hospital patient monitor is a crucial medical device designed to observe and record various vital signs and physiological parameters of patients during their stay in a healthcare facility.
The primary purpose of a patient monitor is to provide healthcare professionals with real-time data on a patient’s vital signs, allowing for continuous assessment and prompt intervention if necessary.
This guide aims to familiarize individuals with basic monitor readings, helping them better comprehend the significance of the information displayed. It’s important to note that while this guide provides valuable insights, it is not a substitute for professional medical advice.
Patients and caregivers should always consult with healthcare professionals for personalized guidance and interpretation of medical data.
Table of Contents
Key Vital Signs Displayed on a Hospital Patient Monitor
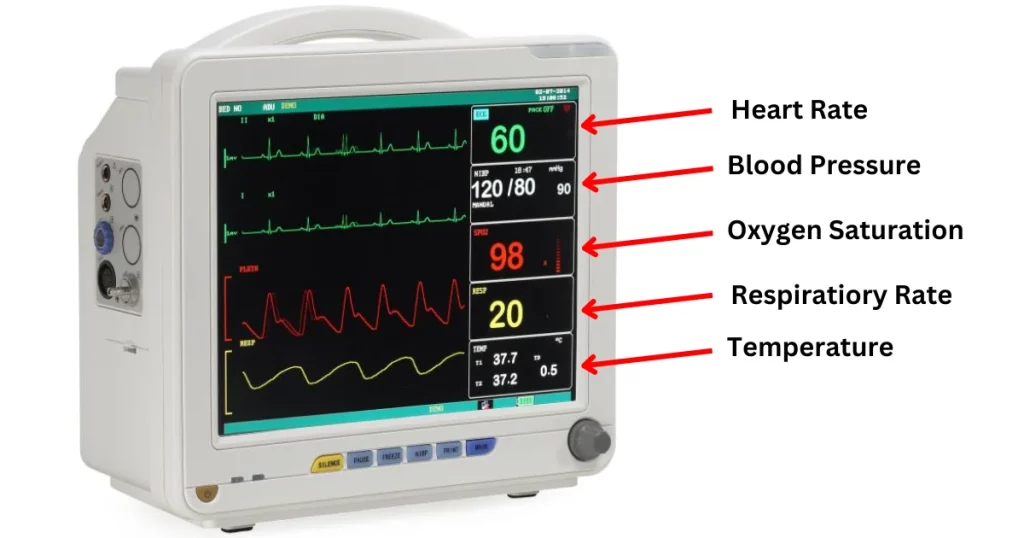
1. Heart Rate (HR):
Picture your body as a well-orchestrated symphony, with your heart acting as the conductor setting the rhythm for everyone else.
In medical diagnosis, we have a special pass to this concert – the hospital patient monitor. This section serves as your backstage tour, offering a glimpse into the basics of what this monitor communicates.
A. What is Heart Rate(HR)?
- Heart Rate (HR) is a measure of how fast your heart beats in a minute.
- For adults, a normal resting heart rate typically falls between 60 to 100 beats per minute (bpm).
B. Why Does It Matter?
- Your HR gives us a sneak peek into your heart’s health and how it responds to various situations.
- Activities like exercise or moments of stress can naturally nudge your heart rate up.
C. Understand Arrhythmias
- Arrhythmias are like irregular beats in the heart’s musical composition.
- The hospital monitor acts as our musical score, detecting issues such as bradycardia (slow beats), tachycardia (fast beats), or irregular patterns.
- Spotting these irregularities early on is crucial for prompt action and tailored care.
Understanding heart rate through monitoring is akin to having a special pass, ensuring that the heart’s performance stays in perfect harmony.
2. Blood Pressure (BP):
Blood Pressure (BP) is like your body’s pressure gauge, measuring the force of blood against the walls of your arteries. It consists of two key numbers – the top number is called systolic pressure, and the bottom one is diastolic pressure.
A. Normal Range Blood Pressure Insights
- A healthy blood pressure reading for adults is generally around 120/80 mm Hg.
- The top number (systolic) represents the pressure when your heart beats, pumping blood into your arteries.
- The bottom number (diastolic) reflects the pressure when your heart is at rest between beats.
B. Systolic vs. Diastolic BP
- Systolic Pressure:
– This is the higher of the two numbers, reflecting the pressure during heartbeats.
– Think of it as the ‘surge’ when your heart contracts and pushes blood into circulation.
- Diastolic Pressure:
– The lower number, representing the pressure when the heart is at rest.
– It’s like the ‘baseline’ pressure, the residual force in your arteries when your heart takes a breather.
C. Significance of Monitoring Blood Pressure
- Monitoring blood pressure helps unveil potential issues like hypertension or hypotension.
- Consistent high or low readings could be signals for further investigation and tailored interventions.
Understanding blood pressure is akin to deciphering the language of your body’s circulation, ensuring that the pressure stays within the perfect range for a healthy performance.
3. Temperature (TEMP)
Temperature monitoring is like keeping tabs on your body’s thermostat, revealing its internal warmth. It’s typically measured in degrees Celsius (°C) or Fahrenheit (°F) depending on the regional preference.
A. Normal Temperature Range Insight
- For adults, the normal body temperature hovers around 98.6°F (37°C), but slight variations can be normal.
- The body is smart; it regulates its temperature within a narrow range to maintain optimal function.
B. Fever
- A rise in temperature often indicates an immune response to an infection or illness.
- Feverish conditions commonly accompany infections and serve as the body’s defense mechanism.
C. Hypothermia Chills
- On the flip side, hypothermia occurs when body temperature drops significantly below the norm.
- Exposure to cold environments or certain medical conditions can lead to hypothermia.
D. The Thermometer Connection
- Temperature is usually measured using a thermometer, either orally, rectally, tympanically (in the ear), or on the forehead (temporal).
- Also, temperature can be measured with hospital patient monitor.
- The choice of method depends on factors like age, health condition, and the precision required.
Understanding body temperature is like gauging the ongoing performance of your body’s biochemical reactions. Keeping it within the normal range ensures the smooth operation of various physiological processes.
4. Respiratory Rate (RR):
The respiratory rate, or RR, is like the silent metronome of life, measuring the number of breaths taken per minute. It reflects the body’s respiratory efficiency and is a key parameter in hospital patient monitoring.
A. The Breath Count
- Normal respiratory rates for adults typically range between 12 to 20 breaths per minute, showcasing the steady dance of inhalations and exhalations.
- Monitoring RR is crucial for assessing lung function and ensuring the body receives an adequate oxygen supply.
B. Tachypnea – Rapid Beats
- Tachypnea is the speedier side of breathing, where the respiratory rate exceeds the normal range.
- It can be a sign of various conditions, such as fever, anxiety, or respiratory distress.
C. Bradypnea – Slow Ballet
- On the contrary, bradypnea is the slow dance, where the respiratory rate drops below the usual tempo.
- Conditions like certain medications or neurological issues can contribute to bradypnea.
Understanding respiratory rate is akin to deciphering the body’s musical composition, ensuring the harmonious exchange of oxygen and carbon dioxide.
5. Oxygen Saturation (SpO2)
Oxygen saturation, often abbreviated as SpO2, measures the percentage of oxygen molecules bound to hemoglobin in the blood. Represented as a vital sign, SpO2 reflects the efficiency of oxygen transport through the bloodstream.
A. Normal Range and Full Spectrum
- A healthy SpO2 level falls within the range of 95% to 100%, showcasing the blood’s vibrant saturation with oxygen.
- This parameter provides a real-time glimpse into the body’s ability to oxygenate tissues and organs.
B. Hypoxemia – Oxygen Starvation
Hypoxemia occurs when SpO2 levels dip below the normal range, indicating insufficient oxygen in the blood. Causes can range from respiratory issues like pneumonia to cardiovascular conditions affecting oxygen delivery.
C. Cautionary Tales
- Monitoring SpO2 is especially critical in situations like anesthesia, where oxygen levels might fluctuate.
- It serves as a guardian alerting healthcare providers to potential respiratory distress, guiding timely interventions.
Understanding SpO2 is akin to decoding the oxygen symphony, ensuring every cellular note receives its vital supply.
Explore our best selling Hospital Patient Monitors: 1. Patient Monitor UPM-9000A. 2. Patient Monitor UPM-9000D
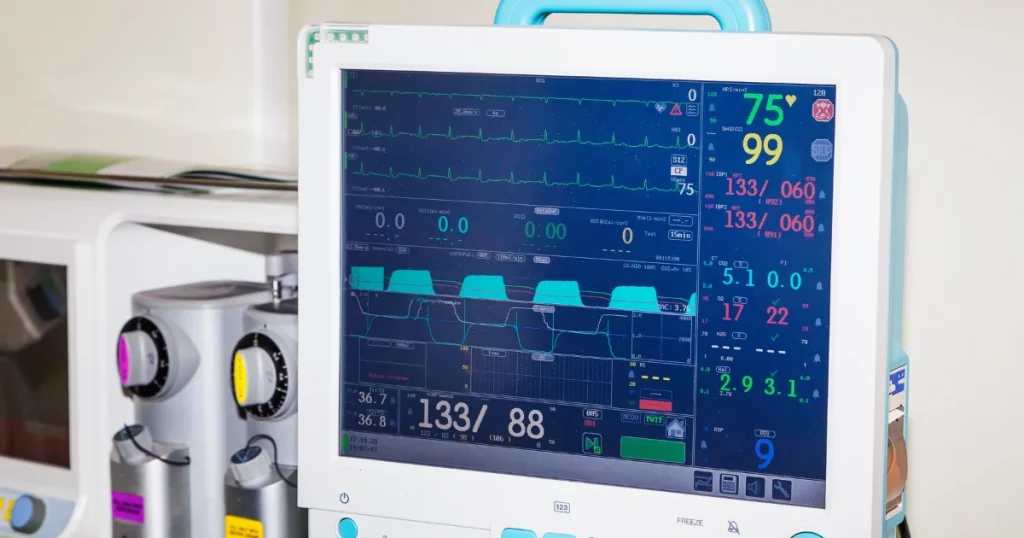
Understanding the Waveforms
Understanding the waveforms provides a crucial glimpse into vital signs, offering healthcare professionals valuable insights for timely and precise medical interventions.
A. ECG (Electrocardiogram)
- The ECG waveform represents the heart’s electrical activity. Each spike (P, Q, R, S, T) signifies specific heart events.
- Medical professionals analyze ECG patterns to diagnose arrhythmias, ischemia, or other cardiac conditions.
B. SpO2 Curve
- The SpO2 waveform depicts the pulsatile nature of oxygen saturation in the blood during each heartbeat.
- Its regular oscillations reveal the ebb and flow of oxygen delivery, providing insights into respiratory and circulatory health.
C. Respiratory Waveform
- This waveform corresponds to the patient’s breathing pattern. Peaks represent inhalation, while troughs denote exhalation.
- Irregularities may indicate respiratory distress, making it crucial for healthcare providers to assess and intervene.
D. Blood Pressure (BP) Waveform
- The arterial blood pressure waveform mirrors the pulsatile expansion and contraction of arteries with each heartbeat.
- Diagnosing conditions like hypertension or hypotension involves scrutinizing the characteristics of this waveform.
E. Temperature Trend
- While not a classic waveform, temperature trends display variations over time.
- Detecting sudden spikes or drops aids in identifying infections, hyperthermia, or hypothermia.
Interpreting these waveforms requires specialized medical training. Laypeople should refrain from attempting detailed analyses. Vital sign monitoring is a complex skill honed through years of education and experience, ensuring accurate assessments and timely interventions by healthcare professionals.
Important Reminders
This guide offers fundamental insights into hospital patient monitor readings. For in-depth understanding and personalized advice, consult healthcare professionals.
If you have questions or concerns about monitor readings, your health, or any symptoms, reach out to healthcare professionals for accurate assessments and guidance.
Refrain from interfering with medical equipment or attempting to adjust monitor settings. Unauthorized changes may compromise accurate readings and patient safety.
If you’re a caregiver, advocate for the patient by promptly reporting any concerns or unexpected changes in hospital patient monitor readings to healthcare staff.
In emergencies, follow healthcare providers’ instructions and call for immediate assistance. Time is crucial, and healthcare professionals are trained to handle urgent situations.
Remember, while this guide empowers you with basic knowledge, your healthcare team is your primary resource for comprehensive and personalized information about your health.
Final Words
By following this step-by-step guide, healthcare professionals can navigate the complexities of a hospital patient monitor effectively. It emphasizes the importance of comprehensive assessment, quick response to alarms, and considering the overall clinical context to ensure optimal patient care and safety.
Source
How to Read a Patient Monitor at the Hospital
FAQ
How can I interpret readings on a hospital patient monitor?
Familiarize yourself with the displayed metrics such as heart rate, blood pressure, oxygen saturation, and ECG waveforms. Consult medical professionals for guidance.
What are the key metrics displayed on a hospital patient monitor, and what do they signify?
Key metrics include heart rate (beats per minute), blood pressure (systolic and diastolic), oxygen saturation (SpO2), and ECG waveforms. They signify the patient’s cardiovascular and respiratory status.
How do the waves and graphs on a patient monitor differ, and what information do they provide?
Waves and graphs represent various physiological parameters. For example, ECG waveforms show the heart’s electrical activity, providing insights into cardiac health.
Is it possible to learn how to read a hospital patient monitor without medical training?
While basic understanding is possible, interpreting complex readings requires medical knowledge. Seek guidance from healthcare professionals.
What are the normal ranges for common readings on a patient monitor?
Normal ranges vary, but common benchmarks include a heart rate of 60-100 BPM, blood pressure around 120/80 mmHg, and oxygen saturation above 95%.
What are the 5 parameters of hospital patient monitor?
Basically, there are 5 parameters in patient monitor. Here are they: 1. ECG (monitor heart rate), 2. NIBP (monitor blood pressure), 3. SpO2 (monitor oxygen saturation), 4. RESP (monitor respiratory rate), 5. TEMP (monitor temperature)